Cookies help us deliver our services. By using our services, you agree to our use of cookies.
You have no items in your shopping cart.
Filter by price
Products tagged with 'momentum'
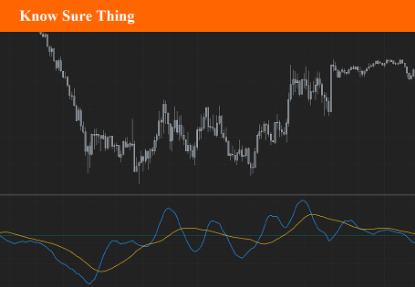
Know Sure Thing
The Know Sure Thing (KST) is a momentum oscillator developed by Martin Pring to make rate-of-change readings easier for traders to interpret.
$9.90
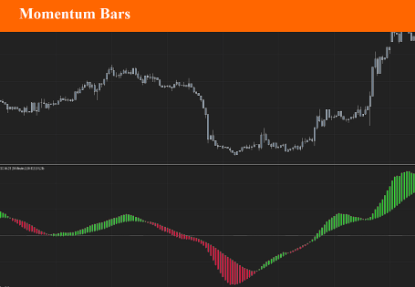
Momentum Bars
Momentum Bars offers a different way to visualize momentum - and uses some simple TA concepts to provide a different perspective into how we read momentum changes and incorporate that in our trading. The idea here (and the script itself) is really super simple, and is inspired by Elder's Impulse System ( EIS ) - then evolved to leverage some other concepts, and to become less cluttering and "easier to read".
$9.90
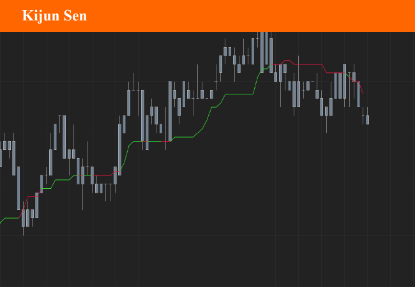
Kijun Sen
Kijun Sen is one of the most important lines of the ichimoku kinko hyo. Kijun Sen represents the average point of the last 26 periods. It is the average of the highest and lowest of the last 26 periods (last 26 candlesticks). The Kijun Sen forms steps. These landings are commonly called "Kijun flats". Kijun flats are important levels of support or resistance. Kijun Sen flats represent the 50% retracement level. Kijun Sen flat is equal to the 50% Fibonacci retracement level. In a trend phase (not in a range period) it is often relevant to consider buying or selling during pullbacks on the Kijun Sen.
$4.90
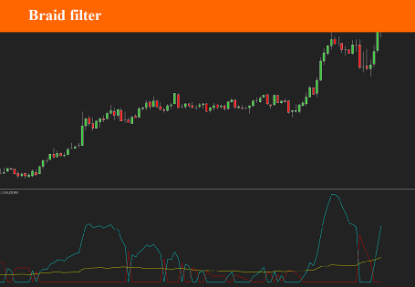
Braid Filter (v1)
The Braid Filter Indicator was first introduced in 2006 by a man named Robert Hill, also known as “Mr.Pips” in Stocks and Commodities Magazine. By the way, Mr. Hill created the first version of this indicator. Over the years, coders created subsequent versions and added modifications. The “braid” is formed by line intersections based on various types of moving averages.
$9.90
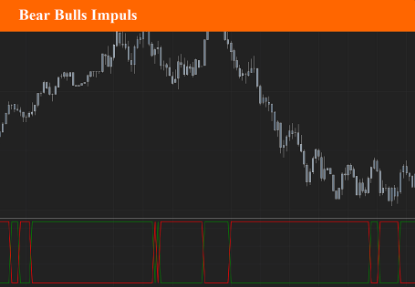
Bears Bulls Impulse
This indicator is an adaptation of the Elder Ray Index indicator developed by Dr. Alexander Elder. The original version was developed in 1989 and was given the name Elder “Ray” because he felt it could see through the market, just as an X-Ray can see your bones through your skin.
$9.90
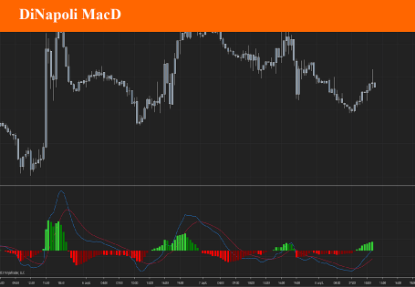
DiNapoli MacD (DEMA)
Dinapoli MacD is a trending indicator that give you not only what direction a market is moving but also how volatile the price is. When the market starts giving new max or minimum level values, the Dinapoli macd follows the price trend direction and pulls up the level of quit from the currency market . Stops should be applied where they are for a purpose, and in that case, should not be changed. The whole idea behind a practical trading plan is to keep it as simple as possible. There are two main advantages to its use. 1. You are able to determine, one period ahead of time, what price will cause theMACD to turn from a buy to a sell or visa versa. It is a cousin to the Oscillator predictor. If you take a position you know right then and there, the exact price, the current and next (future) bar will need to achieve for the MACD to cross. You can also literally see the distance the market has to go, before your current position is either helped or hindered by the force of the next MACD cross. You can do this in all time frames, as the indicator updates in real time. 2. You are able to determine the “Dynamic Pressure” on the market by clearly observing price action with the MACD history. Dynamic pressure refers to how the market reacts to buy and sell signals. If you get a 30 minute sell on the MACD and the market goes flat for example, you know right then and there that the next buy signal is apt to be a big winner! This was something I would regularly do with the standard DiNapoli MACD but now it is so much easier to see!
$9.90
