Cookies help us deliver our services. By using our services, you agree to our use of cookies.
You have no items in your shopping cart.
Filter by manufacturer
Momentum Indicators
Momentum in trading refers to the speed of the price change. Momentum indicators measure this speed, which can be helpful to see an upcoming trend change.
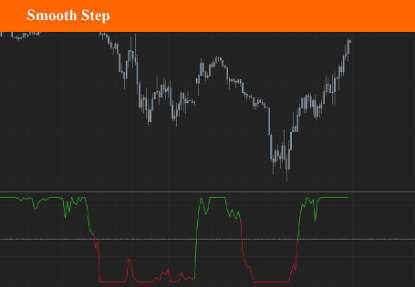
Smooth Step
This indicator was adopted from work done by a very smart guy named Kenneth H. Perlin, who is a professor at New York University in the Computer Science Department. His work centered around something called “Sigmoid Function” having a characteristic “S”-shaped curve or sigmoid curve
$9.90
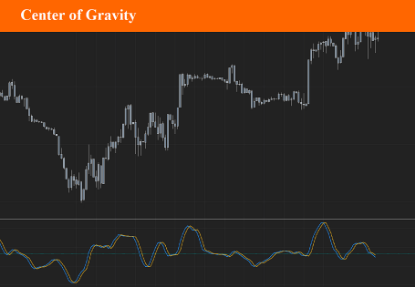
Center of Gravity
The Stochastic Center Of Gravity Indicator was created by John Ehlers (Stocks and Commodities Magazine) It provides a pretty accurate way to see how the stock is trending. If the indicator stays above 0 then the stock is in a pretty strong uptrend and if it stays below 0 then the stock is in a pretty strong downtrend. Buy when the indicator changes crosses 0 upward and sell when it crosses downward.
$9.90
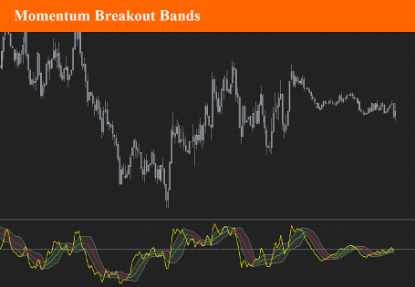
Momentum Breakout Bands
These bands are bollinger bands that have an adjusted standard deviation. There are Buy signals when it has momentum breakouts above the bands for moves to the upside and Sell signals when it has momentum breakouts below the bands for moves to the downside. The bands simply suggest that all markets have periods of chop which we all know to be true. While the price is inside the bands it is said to be trendless. Once the breakouts happen you can take trades in the breakout direction. The bands should work on most instruments and timeframes
$9.90
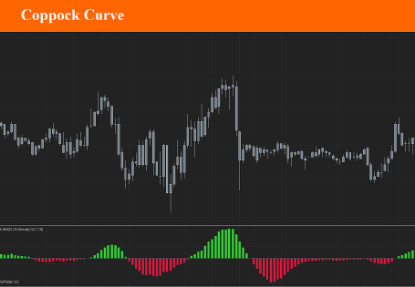
Coppock Curve
The Coppock Curve indicator was developed by an economist named Edwin Coppock in 1962 and was first introduced in that year’s October issue of Barron’s Magazine. It was initially developed for long term monthly charts, shorter timeframes resulted in more frequent signals.
$9.90
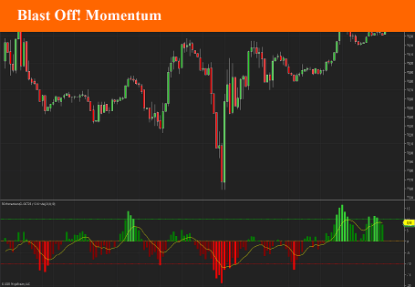
Blast Off! Momentum
This indicator is an alternative interpretation of the Blast Off Indicator by Larry Williams. This formula takes positive and negative magnitudes rather than the absolute value. The result is then smoothed with an EMA, and twice smoothed to provide a signal line. Originaly found on tradingview: https://www.tradingview.com/script/fhjAA1Dq-Blast-Off-Momentum-DW/
$9.90
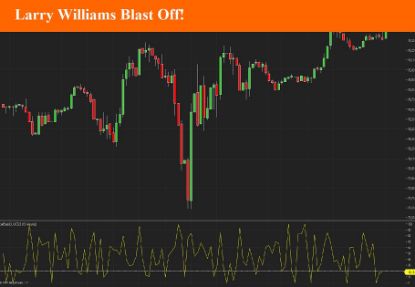
Larry Williams Blast Off!
Indicator designed by Larry Williams, who in 2002 called this indicator Blast Off, which translated means to jump out. The indicator aims to identify price explosions, both positive and negative. To obtain this result the OPEN and CLOSE values are compared with HIGH and LOW and if the difference between the OPEN and the CLOSE of the day is less than 20% of the range (HIGH-LOW), the explosion is likely to occur of price, or if the absolute value of (OPEN-CLOSE) / HIGH-LOW is less than 20% a Blast Off is expected This indicator doesn't work on renko bars, or bars where high-low equals open-close.
$9.90
