Cookies help us deliver our services. By using our services, you agree to our use of cookies.
You have no items in your shopping cart.
Filter by price
nt8Indicators
nt8indicator is a software editor dedicated to the trading world, and more specifically to ninjatrader 8.x
Our goal is to provide you with efficient, inexpensive and easy to use indicators.Some description...
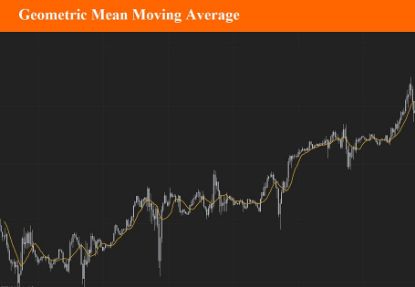
Geometric Mean Moving Average
The Geometric moving average calculates the geometric mean of the previous N bars of a time series. The simple moving average uses the arithmetic mean, which means that it is calculated by adding the time series' value of the N previous bars and then dividing the result with the lookback period. The geometric mean on the other hand is calculated by multiplying the time series' N previous values (multiplication is used instead of the addition) and then taking the N'th root product of the last result.
$9.90
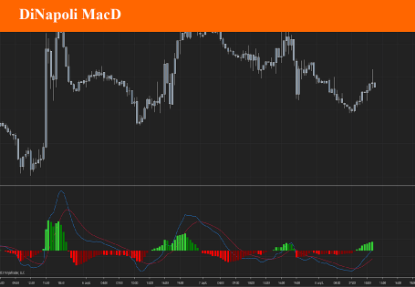
DiNapoli MacD (DEMA)
Dinapoli MacD is a trending indicator that give you not only what direction a market is moving but also how volatile the price is. When the market starts giving new max or minimum level values, the Dinapoli macd follows the price trend direction and pulls up the level of quit from the currency market . Stops should be applied where they are for a purpose, and in that case, should not be changed. The whole idea behind a practical trading plan is to keep it as simple as possible. There are two main advantages to its use. 1. You are able to determine, one period ahead of time, what price will cause theMACD to turn from a buy to a sell or visa versa. It is a cousin to the Oscillator predictor. If you take a position you know right then and there, the exact price, the current and next (future) bar will need to achieve for the MACD to cross. You can also literally see the distance the market has to go, before your current position is either helped or hindered by the force of the next MACD cross. You can do this in all time frames, as the indicator updates in real time. 2. You are able to determine the “Dynamic Pressure” on the market by clearly observing price action with the MACD history. Dynamic pressure refers to how the market reacts to buy and sell signals. If you get a 30 minute sell on the MACD and the market goes flat for example, you know right then and there that the next buy signal is apt to be a big winner! This was something I would regularly do with the standard DiNapoli MACD but now it is so much easier to see!
$9.90
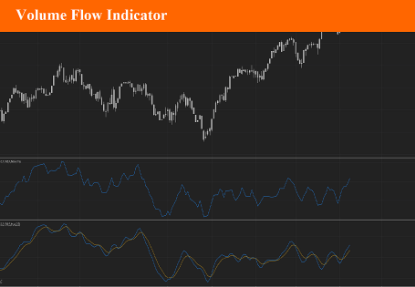
Volume Flow Indicator
VFI,introduced by Markos Katsanos, is based on the popular On Balance Volume (OBV) but with three very important modifications: * Unlike the OBV, indicator values are no longer meaningless. Positive readings are bullish and negative bearish. * The calculation is based on the day's median (typical price) instead of the closing price. * A volatility threshold takes into account minimal price changes and another threshold eliminates excessive volume. A simplified interpretation of the VFI is: * Values above zero indicate a bullish state and the crossing of the zero line is the trigger or buy signal. * The strongest signal with all money flow indicators is of course divergence.
$9.90
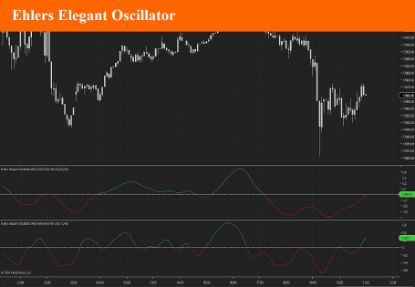
Ehlers Elegant Oscillator
The Elegant Oscillator was created by John Ehlers (Stocks and Commodities Feb 2022 p.21) The Elegant Oscillator is founded on the idea that price tend to return to “normal”, or average levels of its historical mean. It calculates the inverse Fisher transform of price and then applies the SuperSmoother to filter market noise and create a signal line.
$9.90
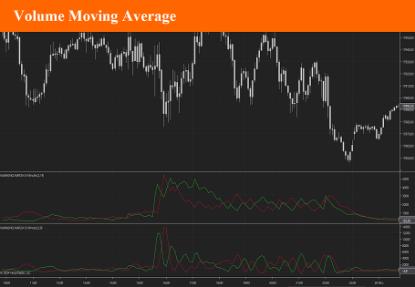
Volume Moving Average
Volume moving average is an indicator based on Ninjatrader Volume Up & Down. It applies a choice of 10 differents moving averages (DEMA, EMA, HMA, LinReg, SMA, TMA, TEMA, VWMA, ZLEMA and WMA). The result is displayed as an "oscillator like" indicator. Buy and sell signals are given in many different ways, so it's up to you to choose the one that suits you best.
$9.90
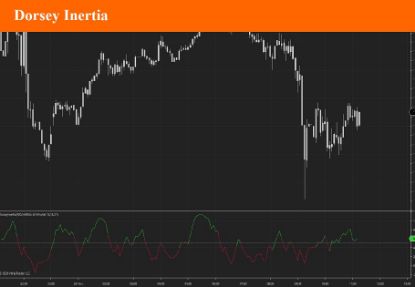
Dorsey Inertia
Developed by Donald Dorsey, the Inertia Indicator is an extension of Dorseys Relative Volatility Index and is used to define the long-term trend and how far it has extended. Its name refers to the physics term and its reference to direction and mass of motion. Dorsey states that a trend is simply the “outward result of inertia” and as such, the market will require much more energy to reverse its direction than to extend the ongoing move.
$9.90
