Cookies help us deliver our services. By using our services, you agree to our use of cookies.
You have no items in your shopping cart.
Filter by manufacturer
Volatility Indicators
Volatility in trading determines the degree to which a price moves over time. High volatility indicates fast and unpredictable price changes. Volatility indicators measure the price range of an asset and help to catch the moments of high volatility.
Many traders favour highly volatile assets and markets because they present numerous trading opportunities along with faster and higher gains.
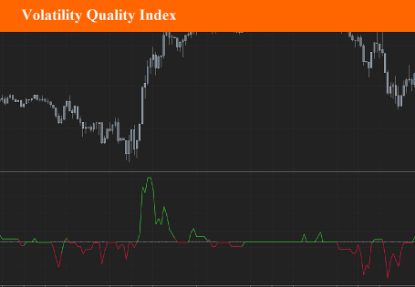
Volatility Quality Index
Volatility Quality Indicator (VQI) is a technical indicator that was developed to identify quality stocks with low volatility. The indicator is based on the assumption that assets with low volatility are less risky and more stable. The original concept by Thomas Stridsman was first published in 2002 and can be found in the Technical Analysis section of Stocks and Commodities magazine.
$9.90
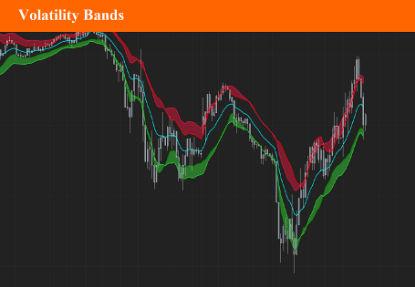
Volatility Bands
The Volatility Bands indicator, attempts to present a way to measure and visualize volatility, using standard deviations (σ) and average true range indicator, and aims to point out areas that might indicate potential trading opportunities. Volatility Bands indicator combines the approach of both Bollinger Bands and Keltner Channel, with different settings and different visualization
$9.90
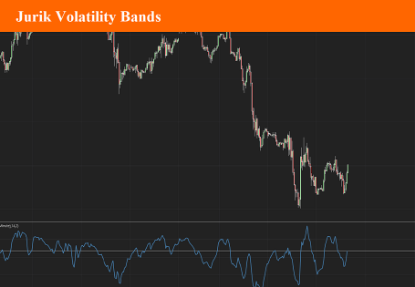
Jurik Volatility Bands
Volatility is a core concept in trading and impacts our trading strategies. Therefore, all traders should have some sort of volatility indicator displayed to gauge the current volatility and future expected moves. Jurik Volatility Bands displays the price inside a volatility channel. In this way, we can measure the current price action in accordance with its volatility.
$9.90


