Cookies help us deliver our services. By using our services, you agree to our use of cookies.
You have no items in your shopping cart.
Filter by price
Filter by manufacturer
Trend Indicators
In trading, trend refers to the direction of the price movement over an extended period of time. For example, when the price is consistently increasing, it’s an uptrend, and when it’s decreasing, it’s a downtrend.
Trend indicators can help determine the direction the market will take.
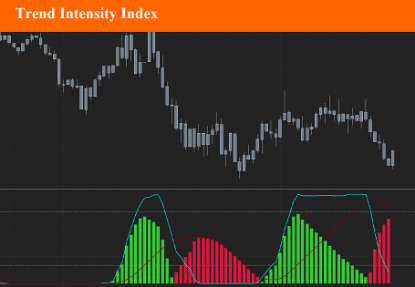
Trend Intensity Index
The Trend Intensity Index (TTI) indicator can help determine the strength of the current market trend. The TII range is between 0 and 100, where typically a value above 50 is a bullish trend, and a value below 50 is a bearish trend.
$9.90
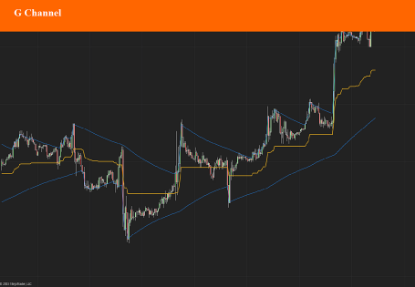
GChannel
This version of the GChannel indicator was created in 2021 by a gifted coder. It’s pretty easy to use and provides clear signals, It may be used as a baseline indicator.
$9.90
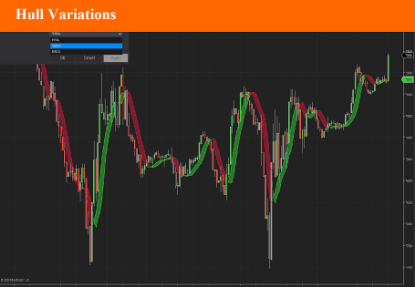
Hull Variations
This indicator include three variations of the basic Hull Moving average: - The Hull Moving average itselve - The Exponential Hull Moving average - The Triple Hull Moving average You can use theses differents types of moving averages as baseline, or confirmation indicator. It work on all assets and all timeframes.
$9.90
Advanced Trend Pressure
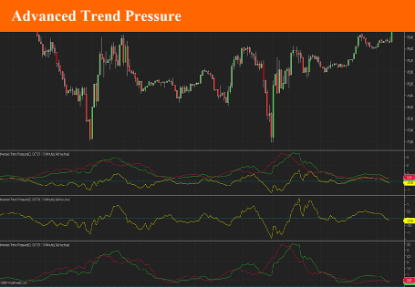
The Advance Trend Pressure indicator shows the trend direction and strength line. It can additionally show the bullish and bearish components of the trend. Trend is determined using Close-Open, High-Close and Open-Close price (for a bearish candlestick) and Open-Close, High-Open and Close-Low prices (for a bearish candlestick) - i.e. the indicator uses the size and direction of candlestick bodies and the size of their shadows. It has three parameters: Period - indicator calculation period; Show lines Up and Down - showing the lines of the bullish and bearish components. Alert - used to display alerts when bullish and bearish lines crosses
$9.90
Sheriff's HiLo
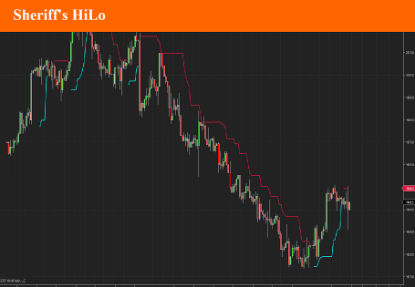
Hopefully, nobody shoot the Sherif here. This confirmation indicator was released recently in the Metatrader ecosystem, and I thought it would be intereting to develop it for the NinjaTrader Paltform. This indicator has 3 main advantages: - it is a very broad signals for long trend moves (short or long). - it is a simple color based identification. - it has only two settings for quick(er) testing. The default settings for this indicator returned very interesting results. nut tweaking the settings sometimes give spectacular, sometimes ordinary results.
$9.90
Geometric Mean Moving Average
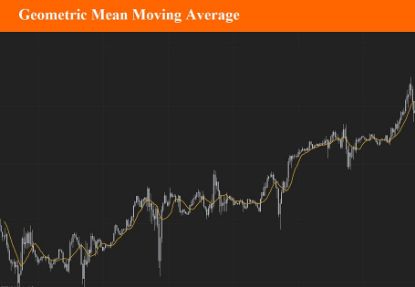
The Geometric moving average calculates the geometric mean of the previous N bars of a time series. The simple moving average uses the arithmetic mean, which means that it is calculated by adding the time series' value of the N previous bars and then dividing the result with the lookback period. The geometric mean on the other hand is calculated by multiplying the time series' N previous values (multiplication is used instead of the addition) and then taking the N'th root product of the last result.
$9.90
